Every number,and the deals behind it.
Sales reports, goals, a forecast and a question box on one Analytics page, with every form's funnel beside them. Filter by date, pipeline, owner or team, compare with last period, and open the deals behind any number.
The sales dashboard
The whole quarter on one screen.
Pipeline by stage, win rate, deals created and won, and activity by rep, filtered by date, pipeline and owner or team, with last period beside this one. Filters stay in the URL, so a view you share opens the same way.
42%
31 won · 43 lost · closed this quarter
Avg won
$18,400
Days to close
34
Reports
The questions every sales leader asks. Answered on one tab.
Each report is a card you can filter, compare with the previous period, export and open to the records behind it.
Win rate and conversion
Win rate with the average won amount and days to close, plus how many deals move from each stage to the next and how many of those are later won.
Time in stage
Median days in each stage, with re-entries added up, so you can see where deals wait and which stage to work on.
Activity by rep
Emails sent, calls made, meetings held and tasks completed per rep for the period, with the previous period beside it.
Lead response time
How long new leads wait for a first touch, as a median per owner, so slow follow-up shows up before the lead goes cold.
MRR won
$84.2k
ARR won
$1.01M
Lapsed
2
Renewals and recurring revenue
Renewals due by month and the renewal rate, next to MRR and ARR won, the run rate and what lapsed, for deals with a recurring amount and renewal date.
Drill-down and export
Every number opens the deals, activities or contacts behind it. Each card exports CSV, a panel explains how the numbers are calculated, and a weekly email sends the summary.
Goals, forecast and questions
Set the target. Call the quarter. Ask anything else.
Goals, the forecast and a question box sit beside the reports. Pin any card to My dashboard, build up to 20 dashboards of your own and share them with the team.
Goals and leaderboard
Set a goal per rep or team, per month or fiscal quarter, for revenue won, deals won, calls or meetings. The leaderboard ranks everyone by attainment or actual, and deal splits give each rep their share.
Forecast
Commit, best case, pipeline and closed per person and team, for a month or fiscal quarter. Categories come from the stage mapping, a rep can override one deal, and submissions are kept.
Which reps closed the most new business in Q3, by amount?
Ask a question
Ask in plain English and get a table back, built only from the records you can see. Save the answer as a card, pin it to My dashboard, or ask the same question from your AI assistant over MCP.
Forms
Every form's funnel, field by field.
The Forms dashboard keeps views, starts, submissions and drop-off for every form, updated as submissions arrive. Open a form to see which question people leave on, with A/B test results beside it.
12,847
9,406 unique
Views
Total and unique views of the form
8,234
64% of views
Starts
People who began answering
6,891
84% of starts
Submissions
Completed submissions
16.3%
1,343 abandoned
Drop-off
People who left before the end
Drop-off by field
Demo request · 1,247 started · Last 30 days
Completion rate
76%
Budget range loses 8% of the people who reach it. Make it optional or add help text, then watch the next 30 days.
Breakdowns
Country, device, source and time to complete.
Each breakdown is a card on the Forms dashboard. utm_source, utm_medium, utm_campaign, utm_term, utm_content and the referrer are captured on every submission, so attribution starts the moment a lead arrives.
By country
Where submissions come from, so you know which markets the form is reaching.
By device
Desktop, mobile and tablet side by side, so a phone-only drop-off stands out.
no UTM40%google / cpc28%linkedin18%email14%By source
Referrer and UTM parameters on every submission, so the report names the campaign, not just the channel.
Average
2m 34s
Completion time
Average, fastest and slowest time to finish, so you can see when a form is asking too much.

Advanced attribution
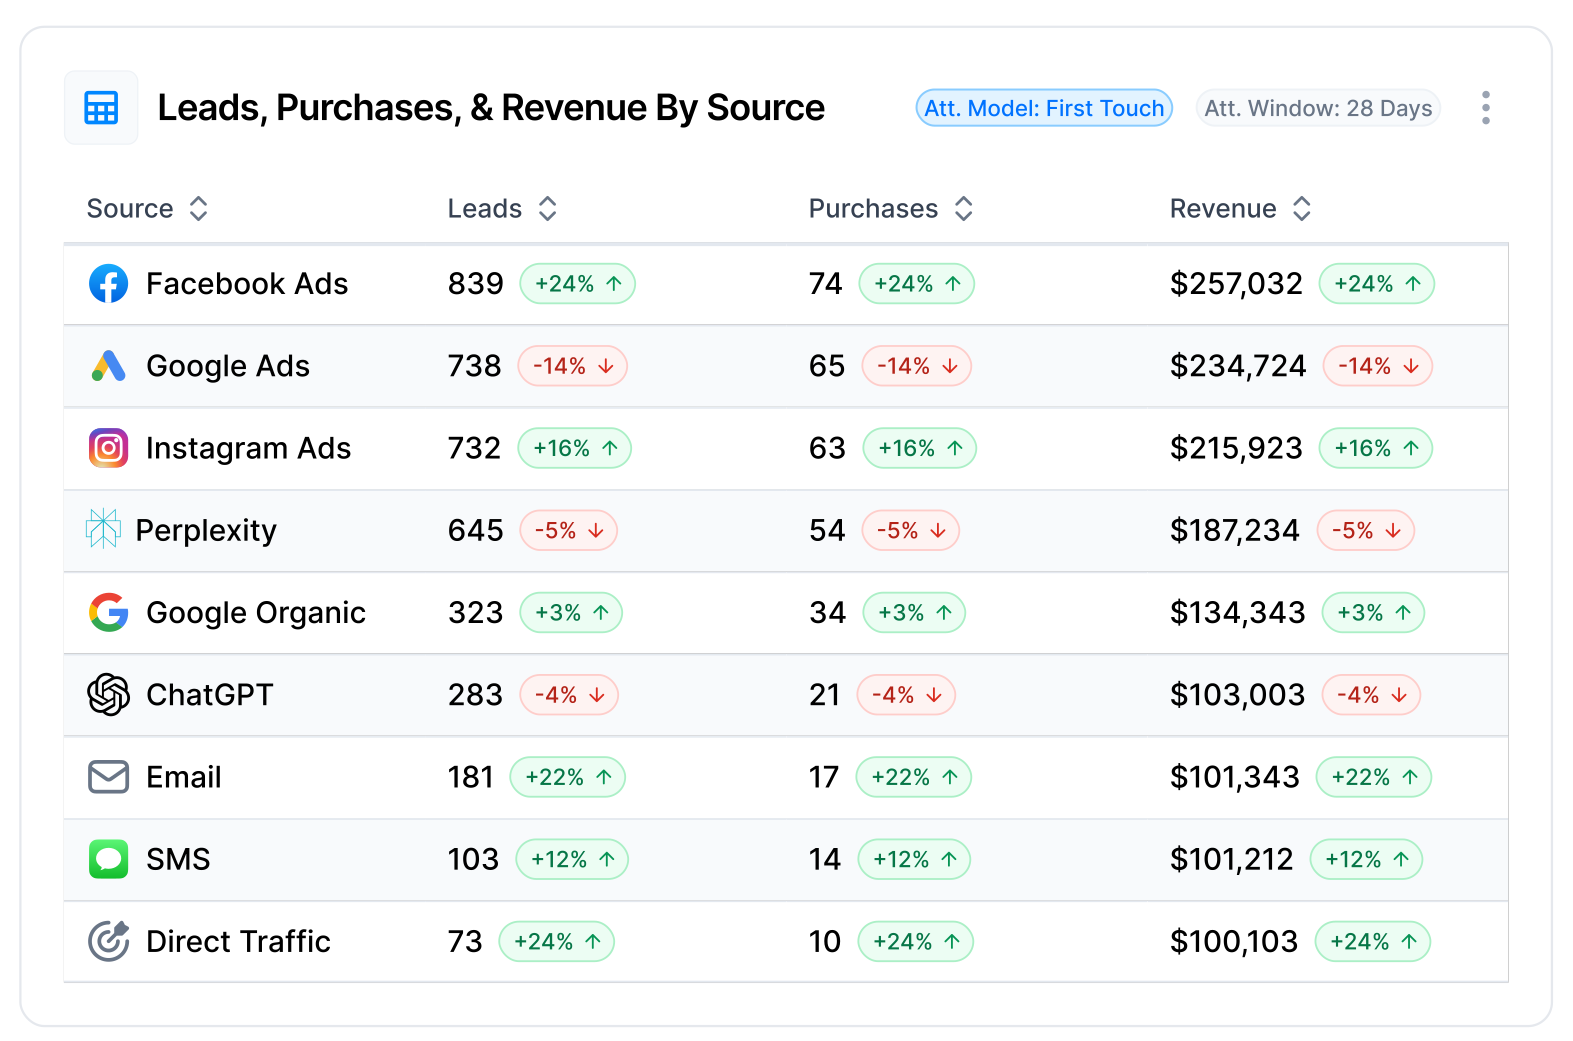
Go beyond UTM parameters. Track the exact ad, keyword, and channel that drove each lead, even across multiple sessions.
- First-party tracking that bypasses ad blockers
- Multi-touch attribution across the full journey
- Sync lead data back to ad platforms
FAQ
Frequently asked questions.
Sales reports, goals, the forecast, questions and form funnels.
See your pipeline in numbers.
Pipeline, win rate, goals and the forecast on one page, with the deals behind every number one click away.
Unlimited seats · MCP access on every plan · Set up by your AI assistant